GDB
The GNU Debugger (GDB) is a portable debugger that works on many Unix systems and programming languages such as Assembly, C, C++, Rust, and others. GDB offers powerful tools for tracing, examining, and altering the execution of computer programs.
When would you use GDB
Suppose you are trying to run a simple program that compiles correctly but does not produce the expected output. GDB is a debugging tool that helps you track your program’s resources and behavior as it executes.
How to use GDB
To use GDB, compile your program with the GCC compiler’s -g flag to include debug information.
gcc -g <file> -o <program_name>
Once compiled, you can open your program in GDB with:
gdb ./<program_name>
When you open GDB, you will see a command prompt. If the program was compiled correctly, GDB will recognize it as a debug file and allow you to start debugging.
CS@Support:~/Gdb_fun$ gcc -g example.c -o example.o
CS@Support:~/Gdb_fun$ gdb ./example.o
GNU gdb (Debian 16.3-1) 16.3
Copyright (C) 2024 Free Software Foundation, Inc.
License GPLv3+: GNU GPL version 3 or later <http://gnu.org/licenses/gpl.html>
This is free software: you are free to change and redistribute it.
There is NO WARRANTY, to the extent permitted by law.
Type "show copying" and "show warranty" for details.
This GDB was configured as "x86_64-linux-gnu".
Type "show configuration" for configuration details.
For bug reporting instructions, please see:
<https://www.gnu.org/software/gdb/bugs/>.
Find the GDB manual and other documentation resources online at:
    <http://www.gnu.org/software/gdb/documentation/>.

For help, type "help".
Type "apropos word" to search for commands related to "word"...
Reading symbols from ./example.o...
(gdb)
After loading the program with debug symbols, it can be helpful to visualize your code and see the current line being executed. You can enable this with the command:
tui enable
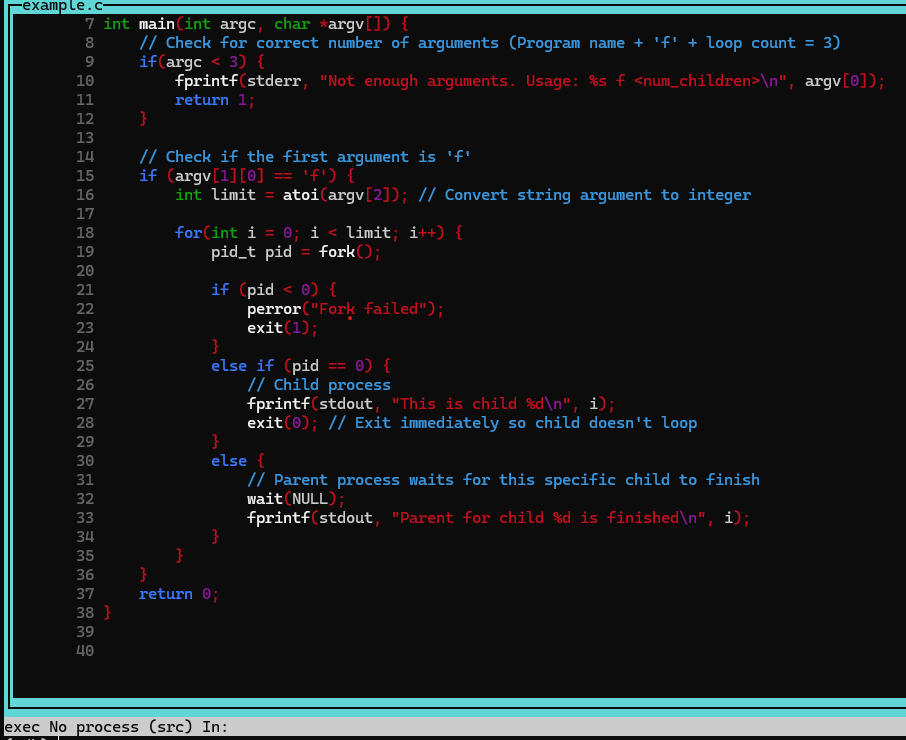
When debugging, you may want to examine your program at a specific moment. To do this, set a breakpoint using the break or b command:
break [Line_Number]
break [Function_Name]
(gdb) b main
Breakpoint 1 at 0x1198: file example.c, line 9.
(gdb) b 15
Breakpoint 2 at ox11cd: file example.c line 15.
(gdb)
Exiting GDB can be confusing at first, but you can use the quit command or ctrl + d to exit whether the program is running or idle.
(gdb) quit
A debugging session is active.

        Inferior 1 [process 920989] will be killed.

        Quit anyway? (y or n) y
CS@Support:~Gdb_fun$
GDB has many commands and to learn more we would encourage you to read the GDB Documentation.
Where is GDB not useful?
GDB can struggle with detecting memory issues. For this, another useful tool is Valgrind. When working with memory, inconsistencies and leaks can happen, but running valgrind on a program file can output potential memory leaks.
valgrind [Program_File]
Valgrind is a powerful tool. For more information, see Valgrind’s manual.